Get Detailed Business Insights with Gridlex AI Advisor
Published | Aug. 22, 2023, 12:57 p.m.
Gridlex AI Advisor is a great tool for managing profit, revenue, cost, and inventory items. With the help of Gridlex Sky AI Advisor, businesses can track and manage their inventory levels, optimize their pricing strategies, reduce their costs, analyze revenue and profit, and improve their overall profitability.
| If you need any help with any feature, data migration of your old accounting data, questions on Chart of Accounts (COA) or anything at all, just email apps@gridlex.com, and our team of expert accountants will be here to help you. Remember, that one of Gridlex’s core values is Customer Success. We want you to be successful. |
Gridlex AI Insights
Gridlex AI insights can provide valuable information about a business's profit, revenue, cost, and inventory. With the help of Gridlex AI Insights, users can analyze financial data and provide insights and predictions about a business's financial health and future performance. This can help accountants identify potential issues and opportunities and make more informed decisions.
AI Profit Advisor
Gridlex AI profit advisor uses artificial intelligence (AI) to analyze a business's financial data and provide insights and recommendations for increasing profit. This can include identifying opportunities for cost savings, identifying potential new revenue streams, and suggesting strategies for improving financial performance.
Step 1: Login into your Gridlex App Suite Account and choose the entity of your choice. Go to the “AI Advisor” tab and select the “AI Profit Advisor” option mentioned in the top menu. Here, users can view their total profit insights, accounts increased the most in Revenue, accounts decreased the most in Cost, etc.

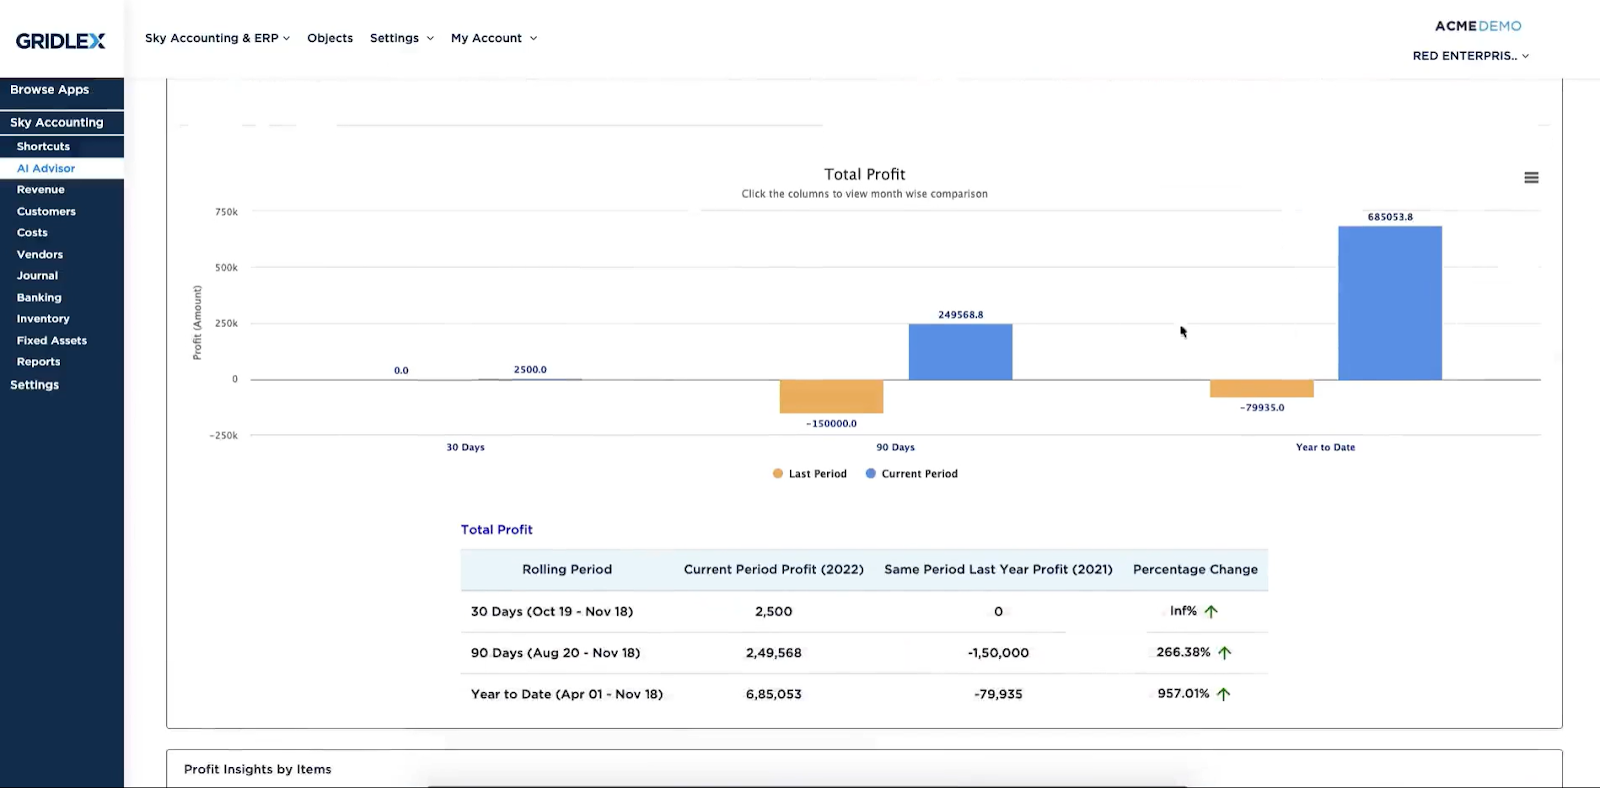
Step 2: If you scroll down, users can view a graphical representation of the total profit from last period to current period.
Step 3: Users can also download the data in different formats by clicking on the button.

Step 4: Users can also view the profit and loss insights by items. For example, in the image mentioned below, you can see the profit for the item named Mobiles has increased from INR 0 to INR 7,63,112. Users can view this data in different periods ranging from 30 days, 90 days and for the past year to date.

Step 5: Users can also view the data in a tabular format for clear understanding of the percentage change in different periods.

AI Revenue Advisor
Gridlex AI revenue advisor uses artificial intelligence (AI) to analyze a business's financial data and provide insights and recommendations for increasing revenue. This can include identifying new potential revenue streams, analyzing customer data to identify upselling opportunities, and suggesting strategies for improving financial performance.
Step 1: Login into your Gridlex App Suite Account and choose the entity of your choice. Go to the “AI Advisor” tab and select the “AI Revenue Advisor” option mentioned in the top menu. Here, users can view their total revenue insights, accounts increased the most in Revenue, accounts decreased the most in revenue, etc.

Step 2: If you scroll down, users can view a graphical representation of the total revenue from last period to current period. Users can also download the data in different formats by clicking on the button.

Step 3: Scroll down to view the revenue insights by item. For example, in the image mentioned below, you can see the revenue for the item named Dry Fruits has decreased from INR 0 to INR 15,00,000. Users can view this data in different periods ranging from 30 days, 90 days and for the past year to date.

Step 4: Here, users can view a graphical representation of the total revenue from last period to current period as well as view it in a tabular format for clear understanding of the percentage change in different periods.

AI Cost Advisor
Gridlex AI cost advisor uses artificial intelligence in identifying areas where it can be applied to save costs, analyzing financial data to identify patterns and trends, and providing recommendations on how to reduce costs while still achieving the desired business outcomes.
Step 1: Login into your Gridlex App Suite Account and choose the entity of your choice. Go to the “AI Advisor” tab and select the “AI Cost Advisor” option mentioned in the top menu. Here, users can view their total cost insights, accounts increased the most in cost, accounts decreased the most in cost, etc. If you scroll down, users can view a graphical representation of the total profit from last period to current period.

Step 2: Users can also view the cost insights by items. For example, in the image mentioned below, you can see the cost for the item named Mobiles has increased from INR 0 to INR 30,000. Users can view this data in different periods ranging from 30 days, 90 days and for the past year to date.
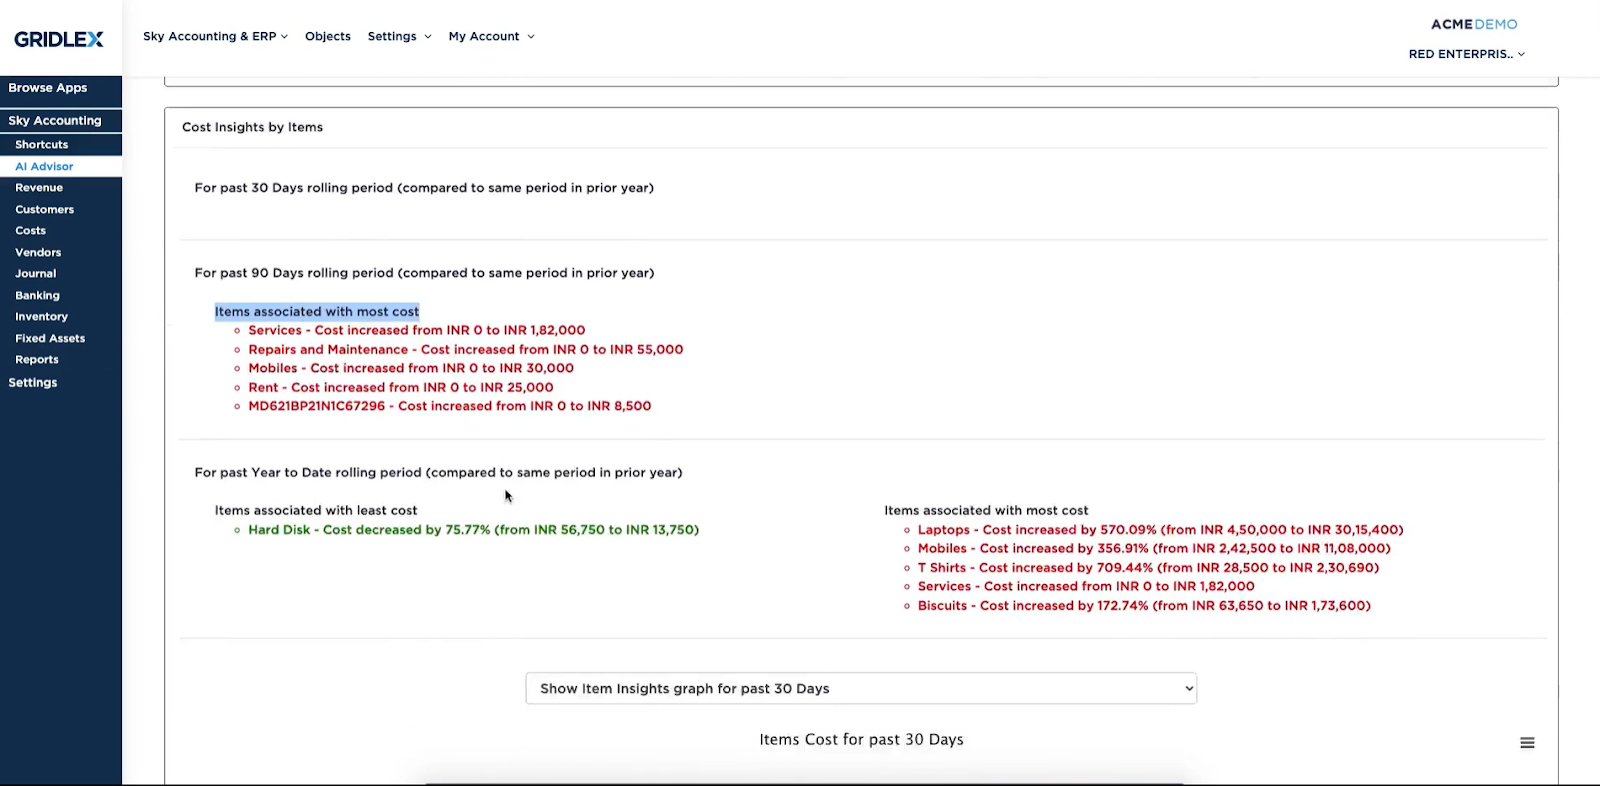
Step 3: Here, users can view a graphical representation of the total items cost from last period to current period as well as view it in a tabular format for clear understanding of the percentage change in different periods.

AI Inventory Advisor
With the help of Gridlex AI Inventory Insights, users can identify past sales data and other factors to predict future demand for products, and adjust inventory levels accordingly. It can also help the users to understand inventory levels, sales patterns, and other factors to optimize inventory levels and reduce excess stock.
Step 1: Login into your Gridlex App Suite Account and choose the entity of your choice. Go to the “AI Advisor” tab and select the “AI Inventory Advisor” option mentioned in the top menu. Here, users can view their total inventory sales insights, items that have increased the sales, items that have decreased the sales, etc. If you scroll down, users can view a graphical representation of the sales from last period to current period.

Step 2: Users can also view the inventory purchases insights by items. For example, in the image mentioned below, you can see the purchase for the item named Mobiles has increased from 0 to 2. Users can view this data in different periods ranging from 30 days, 90 days and for the past year to date.

Step 3: Here, users can view a graphical representation of the total inventory purchases from last period to current period as well as view it in a tabular format for clear understanding of the percentage change in different periods.
